
 With my recent trip to Tech Field Day 14, I was happy to see that we were getting to spend some time with Turbonomic. Although I am not a customer, I have taken a look at their product plenty of times in the past, but one aspect that always held me back was the somewhat dated interface. The tool itself is quite interesting, and I know quite a few people who run it in production, but I had trouble justifying the true monetary value that it offered. I emphasize monetary value as I could easily see the operational value of the tool… keep in mind that I’m an IT Manager by day ;)
Eric Wright and Mor Cohen-Tal gave us a walkthrough of the brand new HTML 5 interface. If you talk to most end-users or customers today, you’ll find that HTML 5 interfaces are high on the priority list. We don’t like having old, clunky consoles, nor do we want to run Flash applications that either suck up battery or cause all of our fans to start spinning at a high RPM. The existing interface was Flash-based (boo), but more so, it looked like it hadn’t been updated in about 10 years. From the customer side of things, it can be difficult to get approval for purchasing something like this. As silly as it sounds, if I am asking for $X for a software purchase, and the person who authorizes it sees what looks to be an outdated interface, I’ll probably start getting some questions.
OUT WITH THE OLD
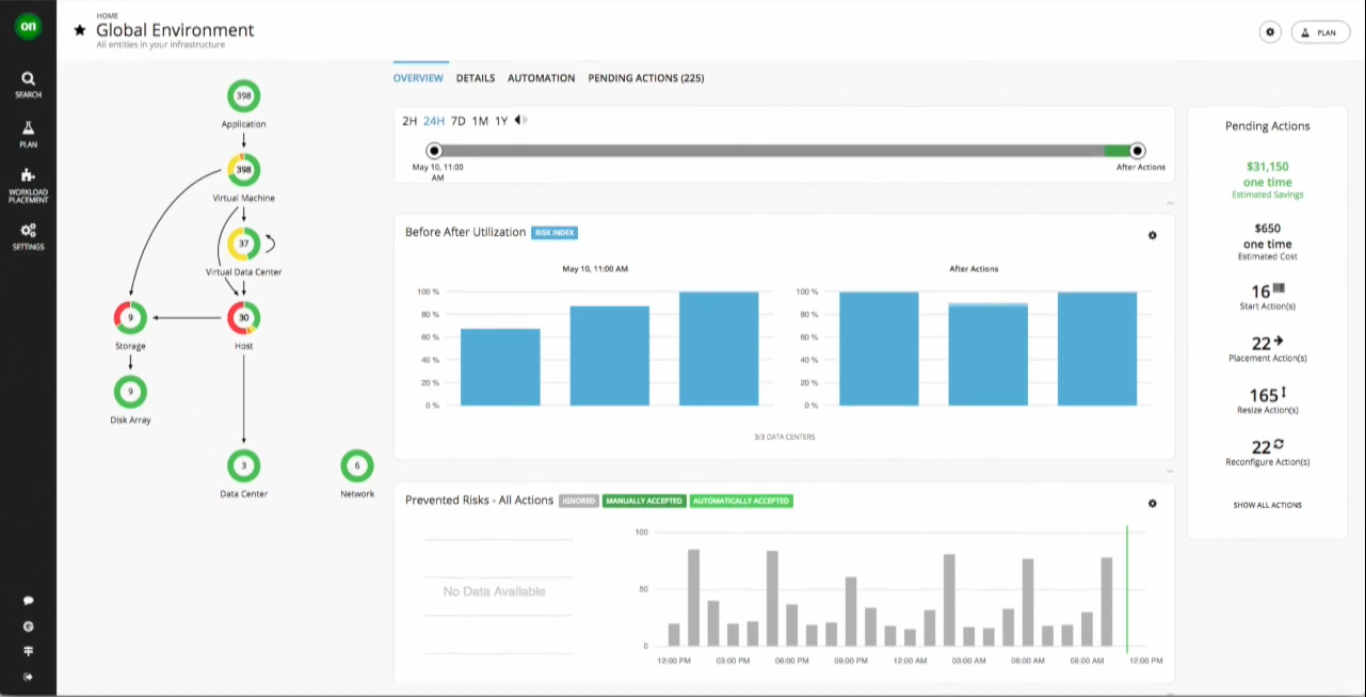 Taking a look at the new dashboard immediately gives you a plethora of easy to read information. On the left, we get a glimpse of how well we are doing with regards to our desired state. Any issues throughout the stack are easily recognizable, as is the severity of the issue due to colour coding. Intuitively, clicking on the troubled areas will bring you to an area where you can see what is wrong, but more importantly, you can implement a fix. While digging down into these problem areas, the “supply chain” on the left will automatically shift its focus to the stack that you are currently viewing. For example, if the “high level” view contains all your applications, VMs, hosts, storage, network, etc., but by clicking on your “applications bulb” you will see which applications are having issues. You can then click on any individual application entry and the supply chain will only show “bulbs” related to that specific application. When trying to troubleshoot, more information is generally better, however, I would argue that this is a case where quality beats quantity.
Most of the pages also contain an easy-to-use slider which will provide stats based on the time period selected. Sometimes we may only care about performance over the last 12 hours, and that can be adjusted. This might be relevant if you need to run end of quarter processes, or something similar. On the flip side, maybe you want to see how the environment has behaved over the course of a longer period. That would be very useful for forecasting future growth requirements based on current data.
SPEND MONEY TO SAVE MONEY
Turbonomic Savings
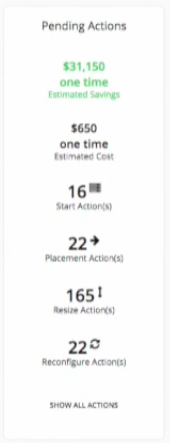
One section of the main dashboard that immediately stuck out to me (likely due to my role as an IT Manager), was the “Pending Actions” portion of the dashboard. Anytime I see software that is showing me a dollar figure, whether that is money required or money saved, it has my attention. In this case, I really liked what I saw.
This particular box assesses your environment based on metrics such as how much contention any of your hosts are experiencing, what is the load on the applications or VMs, etc. You can then assign dollar values to individual components, ranging from the cost of your servers (hopefully you are somewhat standardized on hardware), licensing costs, or storage costs. Metrics will start appearing within an hour and you will start seeing recommendations.
In the event that you have several applications which are overprovisioned, you can have Turbonomic perform actions, such as powering off VMs that are being billed by the hour. You can also set thresholds to say something like “this application needs to run at 95% for one hour before you can add more resources”.
What I really liked is that you can create templates based on your existing machines, but you can also import or export XML templates. Turbonomic is hoping that users will start sharing those files on their community site, Green Circle. The XML exports also serve nicely if you have multiple instances running and you want to keep things standardized.
TYING IT ALL TOGETHER
When I wrote my primer piece on Turbonomic going into Tech Field Day 14, I tried to hit home what their vision of the desired state was. This new interface makes that much easier to see, but more importantly, it makes it much easier to achieve. Being able to very quickly identify bottlenecks, see what is required to remediate the problem, AND knowing what the cost to remediate will be … well, that makes this a very useful tool for managing datacenters. By the end of the sessions, I was seeing all sorts of usage scenarios in my head where a tool like this can save organizations some real money.
You can check out the full video on the Tech Field Day site, and you can also register for a trial version of Turbonomic.
Disclaimer: I was invited to participate in Tech Field Day as a delegate. All of my expenses, including food, transportation, and lodging were covered by Gestalt IT. I did not receive any compensation to write this post, nor was I requested to write this post. Anything written above was on my own accord. Extra Bonus Disclaimer: Turbonomic is a sponsor on this site, however I was not requested or paid to write this post, nor was I requested to write this post. Anything written above was on my own accord.