Collecting & Replaying Data With esxtop Batch Mode & VisualEsxtop
Recently I was in a situation where a customer needed to capture esxtop data during a performance impacting event, however the cause of the event was unknown. What this resulted in was hours and hours of testing (e.g. throwing large amounts of traffic & compute load against some VMs), hoping that the event would trigger.
There were a few downsides to this approach, most notably:
- Significant investment in time, most of which was spent watching nothing happen;
- Not knowing what datapoints we needed to capture to isolate the problem (e.g. host, storage, network, application metrics, etc.)l
- The risk of missing something during an event (which may last 30 seconds … there is a lot of data to look at in that time, especially if you don’t know what you are looking for).
Just like how PING is one of the most useful tools when troubleshooting network issues, esxtop is up there with displaying all sorts of data about your ESXi host, including VM performance and networks stats.
CAPTURING THE DATA
We all agreed the esxtop data would be ideal, but screen captures wouldn’t cut it. That’s where esxtop batch mode comes in. If you aren’t familiar with it, batch mode is a simply a way to pipe esxtop data out to a file. It is as simple as running esxtop -b > filename.csv. There are several arguments available which can be used with batch mode, such as delays between captures and number of iterations to captures.
One of the challenges with data collection like this is the vast amounts of data. When collecting all stats, you are collecting dozens of data points with each iteration. If you run this for a 5 minute period, every second that is 300 x the number of stats per collection. The number of stats will vary based on things like number of CPUs in your host. To get around this, you can run a simple bash script that will start and stop collection every X seconds. In our case, it was very helpful so that when the incident happened, we could note the time, and quickly figure out which file we should look in.
For example, the following commands will record stats every two seconds, 600 times. This results in 10 minutes worth of performance data. Further to that, the loop at the begining will run that 6 times, resulting in one hours worth of data.
for i in $(seq 1 6)
do
esxtop –b –d 2 –n 600 > esxtopcapture$i.csv
done
You can then take that command, put it into a bash script, and run it from your ESXi host.
REVIEWING THE DATA
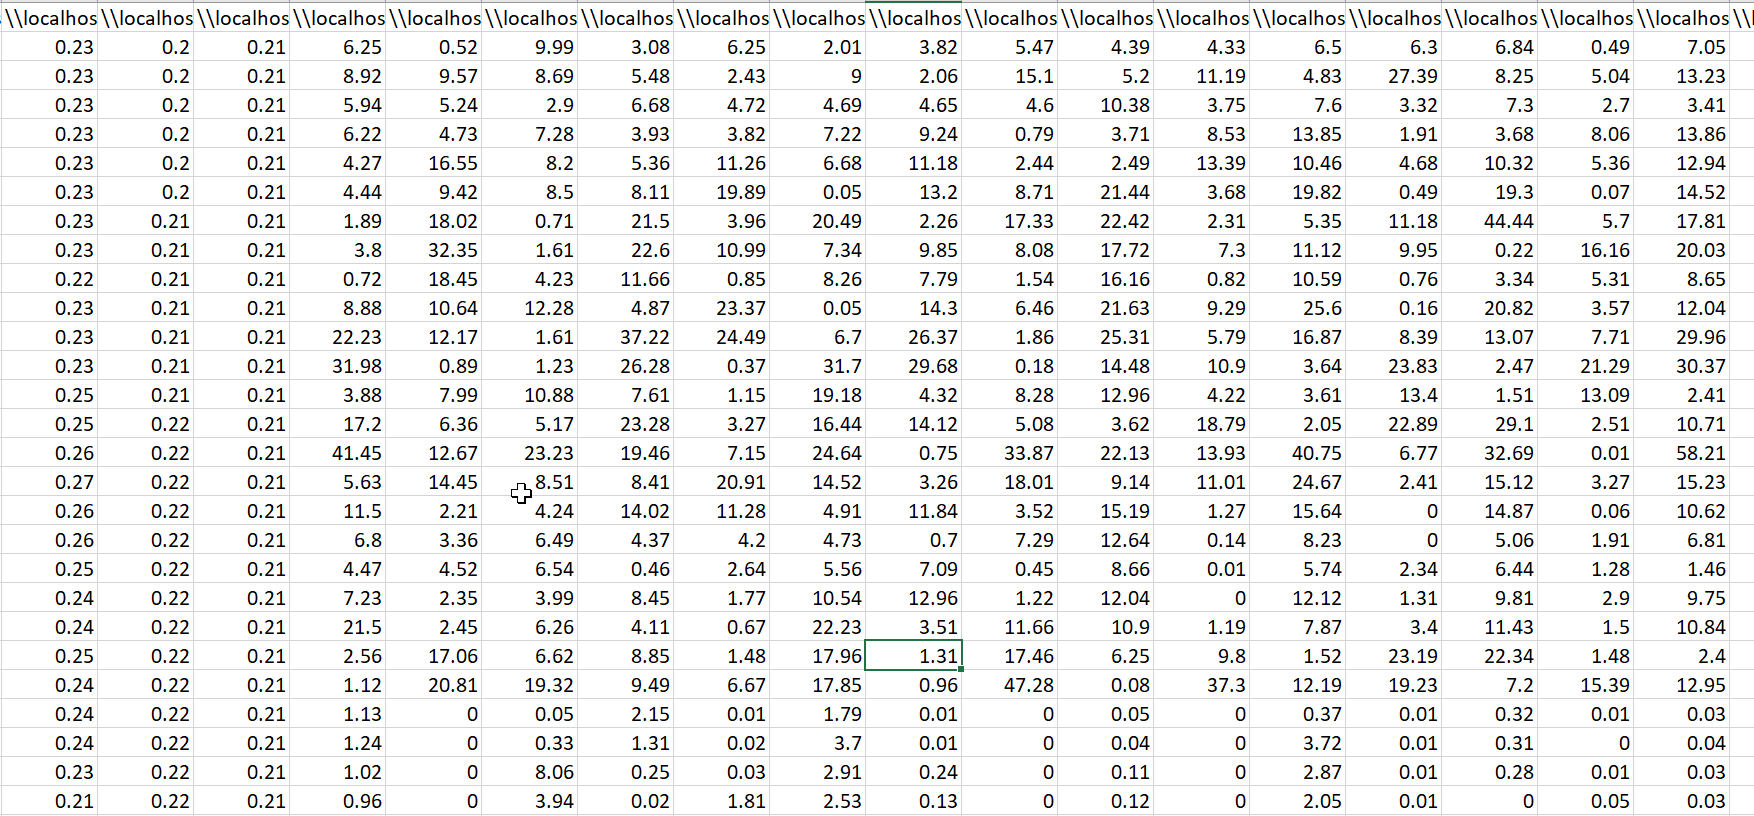
 As mentioned, these files are large. Sure, you can open Excel, but you’ll be looking at one very hard to read spreadsheet. Fortunately, there is a fling called VisualEsxtop which can replay these files. You can load them up, and you’ll be able to replay the files in real time. Additionally, you will also be able to switch between different views such as CPU, network, or disk.
The one qualm I have about it is that I can’t fast forward or rewind; the larger the files are that you create with the command above, the more data you’ll have to sift through.


